
How to use the Elliott Wave Theory in UK forex trading?
The Elliott Wave Theory is a means of analyzing price action to predict future movements. It was developed by Ralph Elliott in the 1930s and has been used by traders ever since to predict market movements.
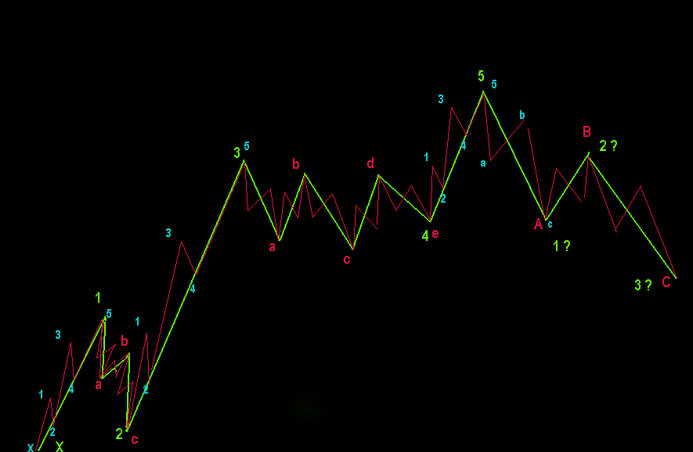
The theory is based on the idea that markets move in waves and that these waves can predict future movements. The Elliott Wave Theory uses three main wave patterns: impulse waves, corrective waves, and motive waves.
Impulse wave
Impulse waves are bullish waves that occur when demand exceeds supply. These waves mark the beginning of a new trend and consist of five sub-waves. Once these waves have been completed, a corrective wave will usually follow.
Corrective wave
Corrective waves are bearish waves that offer little movement. This type of wave usually consists of three sub-waves, labelled as A, B and C. As with impulse waves, there are five sub-waves in corrective waves.
Motive waves
Motive waves are the final stage of a strong trend and will follow an impulse or corrective wave. These waves consist of five sub-waves, just like an impulse wave, but move against the previous trend. Motive waves mark the end of a trend.
The Elliot Wave Theory can predict future price movements by taking two steps: first, determine whether the market is uptrend or downtrend; second, use trends within corrections to predict future movements in either direction.
Elliot Waves two steps in prediction:
- First, identify an uptrend or downtrend within the price action. A series of impulse waves down would suggest that the market is in a downtrend, while an impulsive wave up indicates an uptrend.
- Secondly, look at how corrections are moving to predict future movements. If prices are rising within corrections on the hourly chart, this could indicate that they will also increase when the correction ends, and motive waves begin.
Bearish corrections usually consist of three sub-waves labelled A, B and C; bullish corrections typically consist of five sub-waves labelled 1, 2, 3, 4 and 5
An impulse wave can often be found within a correction. If waves 1, 3 and 5 are rising from left to right, this suggests that they will continue to rise when the correction ends, and motive waves begin.
So far, we have covered identifying corrections using the Elliott Wave Theory. Using the theory can also predict future trends with great accuracy by looking at two key levels: completed patterns and extension levels. After a series of impulse or corrective waves, finished designs are found and mark a significant turning point in price action.
- Identification of these completed patterns will help determine where prices could go once the pattern is broken; so for example, if an ABC correction forms a flat formation as it approaches the top of the trend, it is likely that prices will break to the downside as the correction completes
- Completed patterns can also be used to determine extension levels. These are found by measuring the length of waves 1, 3 and 5 and then dividing this number by 2. This gives us the distance that prices could potentially travel in the opposite direction from where they are currently trading
We have now covered how to use the Elliott Wave Theory to predict future price movements.
To be successful with this method, it is essential to remember a few key points.
Key points
- The market moves in waves, which can predict future movements.
- Corrections usually move in three sub-waves (A, B and C), while motive waves move in five sub-waves (1,2,3,4 and 5)
- Completed patterns can determine where prices could go once the pattern is broken. Extension levels are measured by taking three primary waves and dividing them into two
Interested in trading with the Elliott wave theory? Check out Saxo capital markets for more information.